Mastering Server Health: A Guide to Checking Memory Usage

In the ever-evolving landscape of server management, keeping a close eye on memory usage is paramount. Ensuring that your server's memory is optimally utilized is crucial for maintaining performance and preventing potential issues. In this blog, we will explore various methods to check your server's memory usage, empowering you with the tools to monitor and manage your system effectively.
1. Command-Line Tools
a. free Command:
The free command is a straightforward and powerful tool for checking memory usage on Linux-based systems. Open your terminal and type:
free -h
This command displays information about total, used, and free memory, both in actual values and percentages. The -h flag makes the output human-readable.
b. htop Command:
For a more interactive and visually appealing experience, consider using the htop command. Install it if you haven't already:
sudo apt-get install htop   # For Debian/Ubuntu
sudo yum install htop       # For CentOS
Then, run htop in the terminal to see real-time memory usage, along with other system metrics.
2. GUI Tools
a. Task Manager (Windows):
On Windows servers, the Task Manager provides a user-friendly interface to monitor memory usage. Right-click on the taskbar, select "Task Manager," and navigate to the "Performance" tab to view memory metrics.
b. Activity Monitor (Mac):
Mac users can rely on the built-in Activity Monitor. Launch it from the Applications > Utilities folder, and head to the "Memory" tab for an overview of memory usage.
3. Monitoring Solutions
a. Prometheus and Grafana:
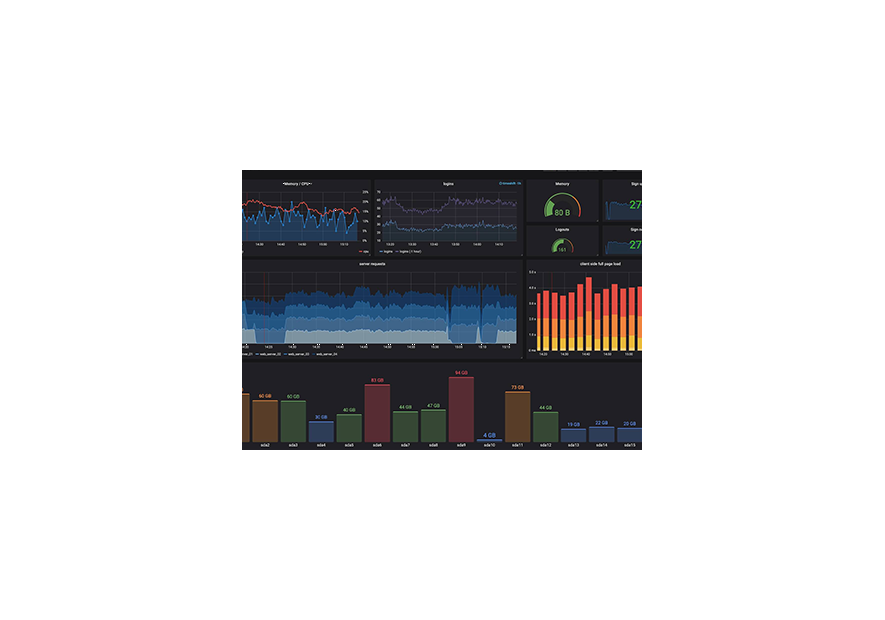
For a comprehensive and scalable solution, consider implementing Prometheus and Grafana. Prometheus collects metrics from configured targets, and Grafana provides a rich visualization of the data. This setup is widely used for monitoring server performance, including memory usage.
b. Nagios:
Nagios is a robust monitoring system that can be configured to check various aspects of server health, including memory usage. It provides alerts and notifications when predefined thresholds are exceeded.
4. Cloud Provider Tools
a. AWS CloudWatch:
If your server is hosted on Amazon Web Services (AWS), CloudWatch offers detailed insights into memory usage. You can set up custom alarms to receive notifications based on specific memory thresholds.
b. Google Cloud Monitoring (formerly Stackdriver):
For Google Cloud users, the Monitoring service provides real-time monitoring and alerting capabilities. It allows you to visualize memory usage trends and set up alerts.
5. Custom Scripts
For a tailored approach, you can create custom scripts to check memory usage. Languages like Bash, Python, or PowerShell can be used to fetch memory metrics and trigger actions based on predefined conditions.
Conclusion
Effectively monitoring your server's memory usage is an integral part of maintaining a healthy and high-performing system. Whether you prefer command-line tools, graphical interfaces, third-party solutions, or cloud provider tools, there are various options to choose from. Select the method that aligns with your preferences and requirements, and make monitoring a regular practice to proactively address any memory-related issues. By staying vigilant, you can ensure that your server operates smoothly and efficiently, providing optimal performance for your applications and services.


